📊 Trades & Charts
Your Complete Trading Journal
TradeMetrics automatically loads all your trades from MetaTrader 5 or crypto exchanges and displays them in a clean, powerful table. Grouped by month and week, enriched with dozens of metrics, and equipped with TradingView-style charts — this is your trading diary on a whole new level.
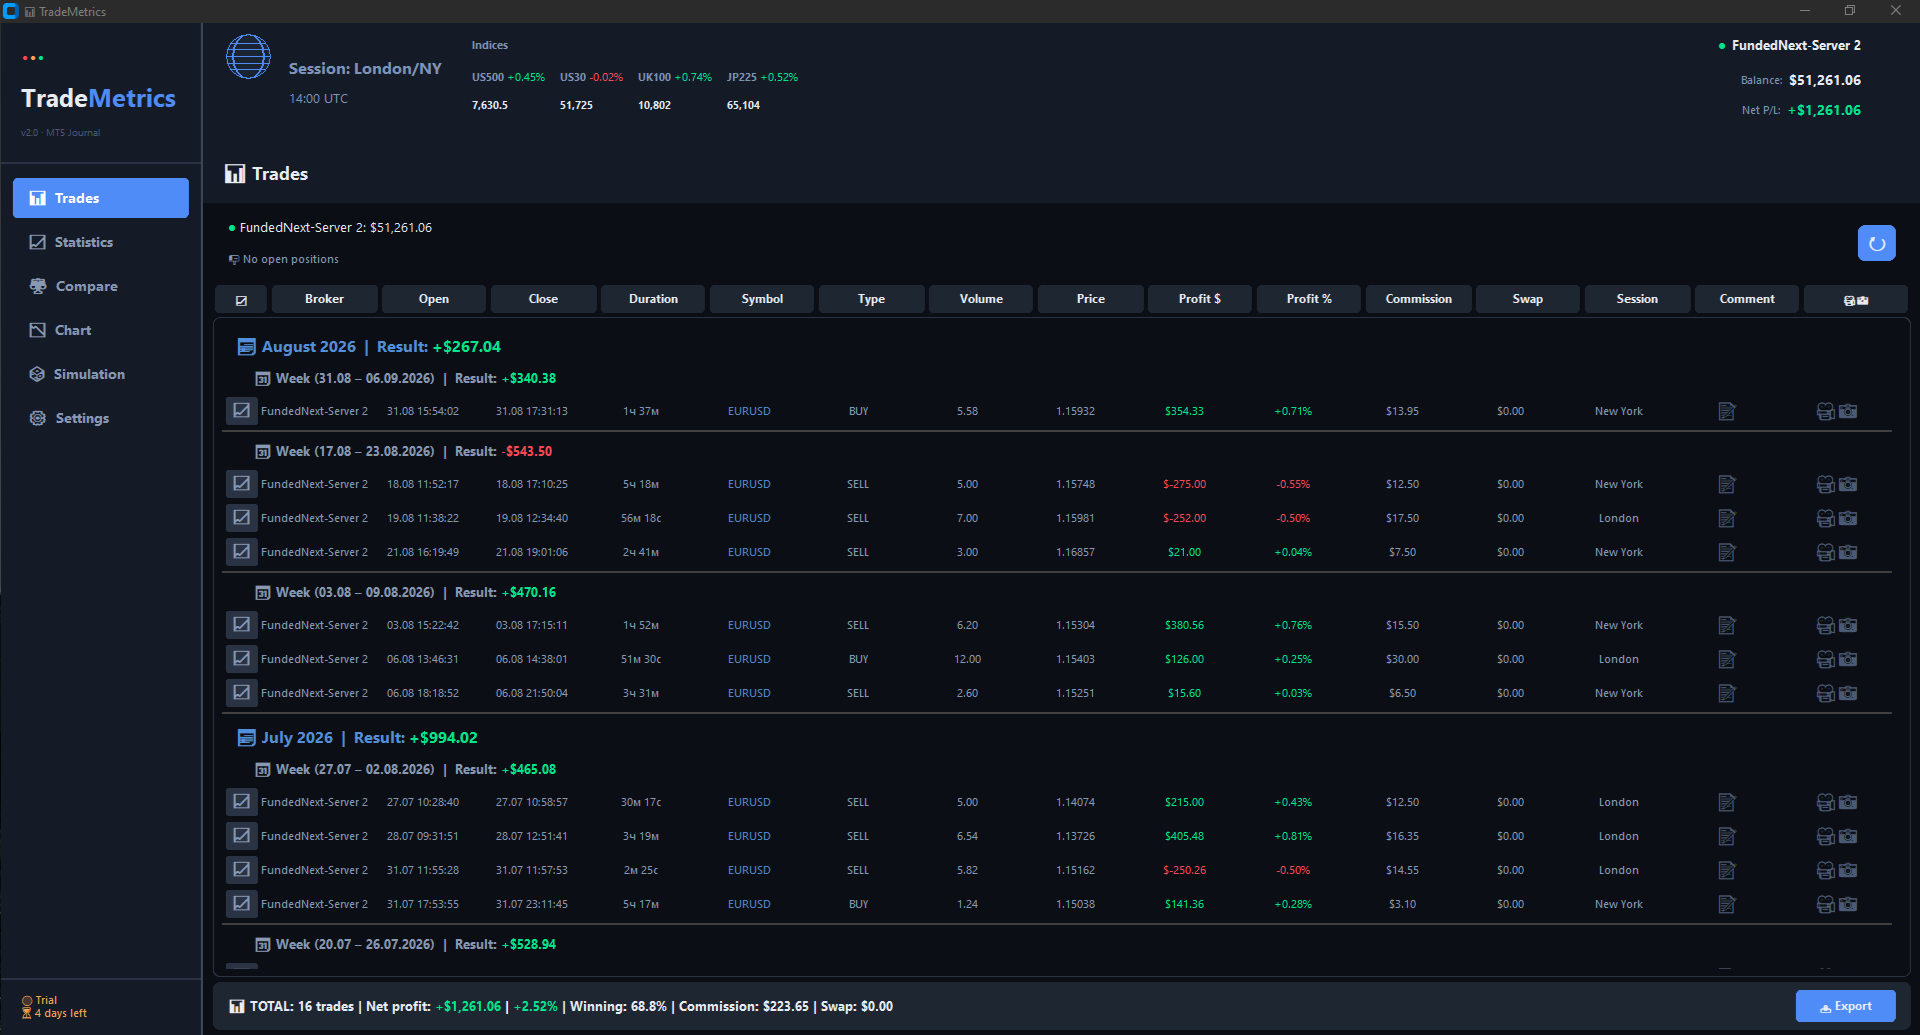
All trades loaded automatically — grouped by month and week
📅 Grouped by Month & Week
Your trades are automatically organized into a clear hierarchical structure:
- 📅 Month — see the total result for each month at a glance
- 📆 Week — see the result for each week inside the month
- 🔹 Trade row — every individual trade with full details
This structure makes it easy to spot patterns, evaluate monthly performance, and compare weeks against each other.
📋 Column Reference
Every column in the table gives you a specific piece of information:
🟢 Live Open Positions
At the top of the Trades tab, right below the status bar, you'll see a live open positions panel. It shows all currently open positions on your account and updates automatically every 3 seconds.
For each open position you'll see:
- 📈 Symbol — the instrument you're currently trading (e.g. EURUSD, BTCUSDT)
- 🟢🔴 Type — BUY or SELL direction
- 📊 Volume — current position size
- 💰 Entry price — where you opened the position
- 📉 Current price — live market price right now
- 💵 Profit / Loss — unrealized P/L in real time (green if profit, red if loss)
When you have no open positions, you'll see the message "📭 No open positions".
💡 Real-time monitoring: The panel refreshes every 3 seconds, so you can see your open P/L update live without leaving the journal. Perfect for monitoring active trades while reviewing your closed history.
📈 TradingView-Style Charts
Click the 📈 button in any trade row — and a standalone TradingView chart window opens for that trade. The chart shows:
- 🕯️ Candlestick chart of the symbol at the time of the trade
- 🟢 Entry marker — where you opened the position (with price)
- 🔴 Exit marker — where you closed the position (with price)
- 📊 TRADE RESULT panel — Change % and Profit $ at a glance
- 📉 MFE / MAE — Maximum Favorable / Adverse Excursion
- 📊 Volume panel at the bottom
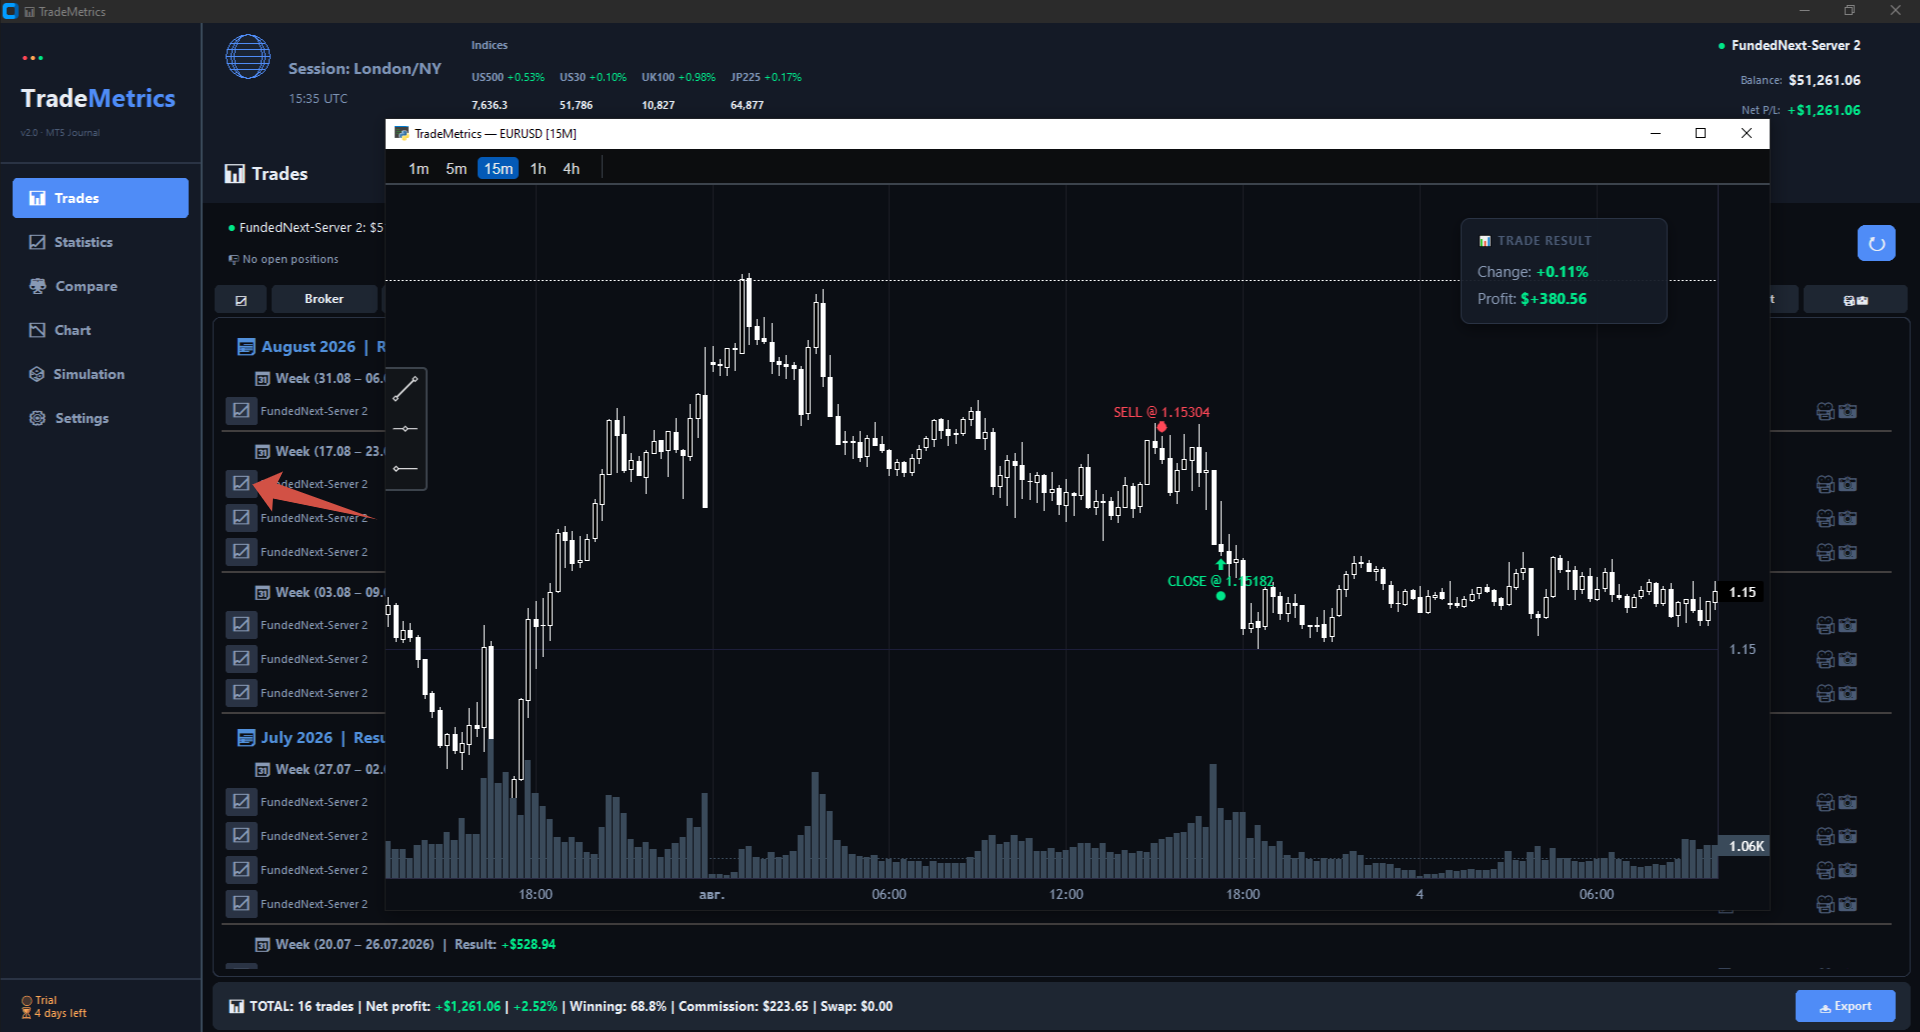
Standalone chart window — entry/exit markers, TRADE RESULT panel, MFE/MAE, and volume
🔄 Timeframe Switching
Inside the chart window you can switch between 5 timeframes with one click:
- 1m — 1 minute (best for scalping)
- 5m — 5 minutes
- 15m — 15 minutes
- 1h — 1 hour
- 4h — 4 hours
The chart automatically re-centers on the trade every time you switch timeframes, so you always see the trade in context.
✏️ Drawing Tools
The chart includes a built-in toolbox on the left side with classic drawing tools:
- 📏 Trend lines
- 🔲 Rectangles
- 📐 Fibonacci retracements
- 🎯 Horizontal and vertical lines
Use them to mark support/resistance levels, identify patterns, or annotate your analysis directly on the trade chart. Drawings stay on the chart even when you switch timeframes.
📊 Multi-Chart Comparison
One of the most powerful features — open multiple chart windows at once to compare trades side by side.
For example: open 3 charts for 3 different trades of the same symbol and see how your entries/exits differ. Or compare the same trade across 2 different timeframes to understand the market context.
Each chart window is fully independent — its own timeframe, its own drawings, its own zoom level. Perfect for detailed post-trade analysis.
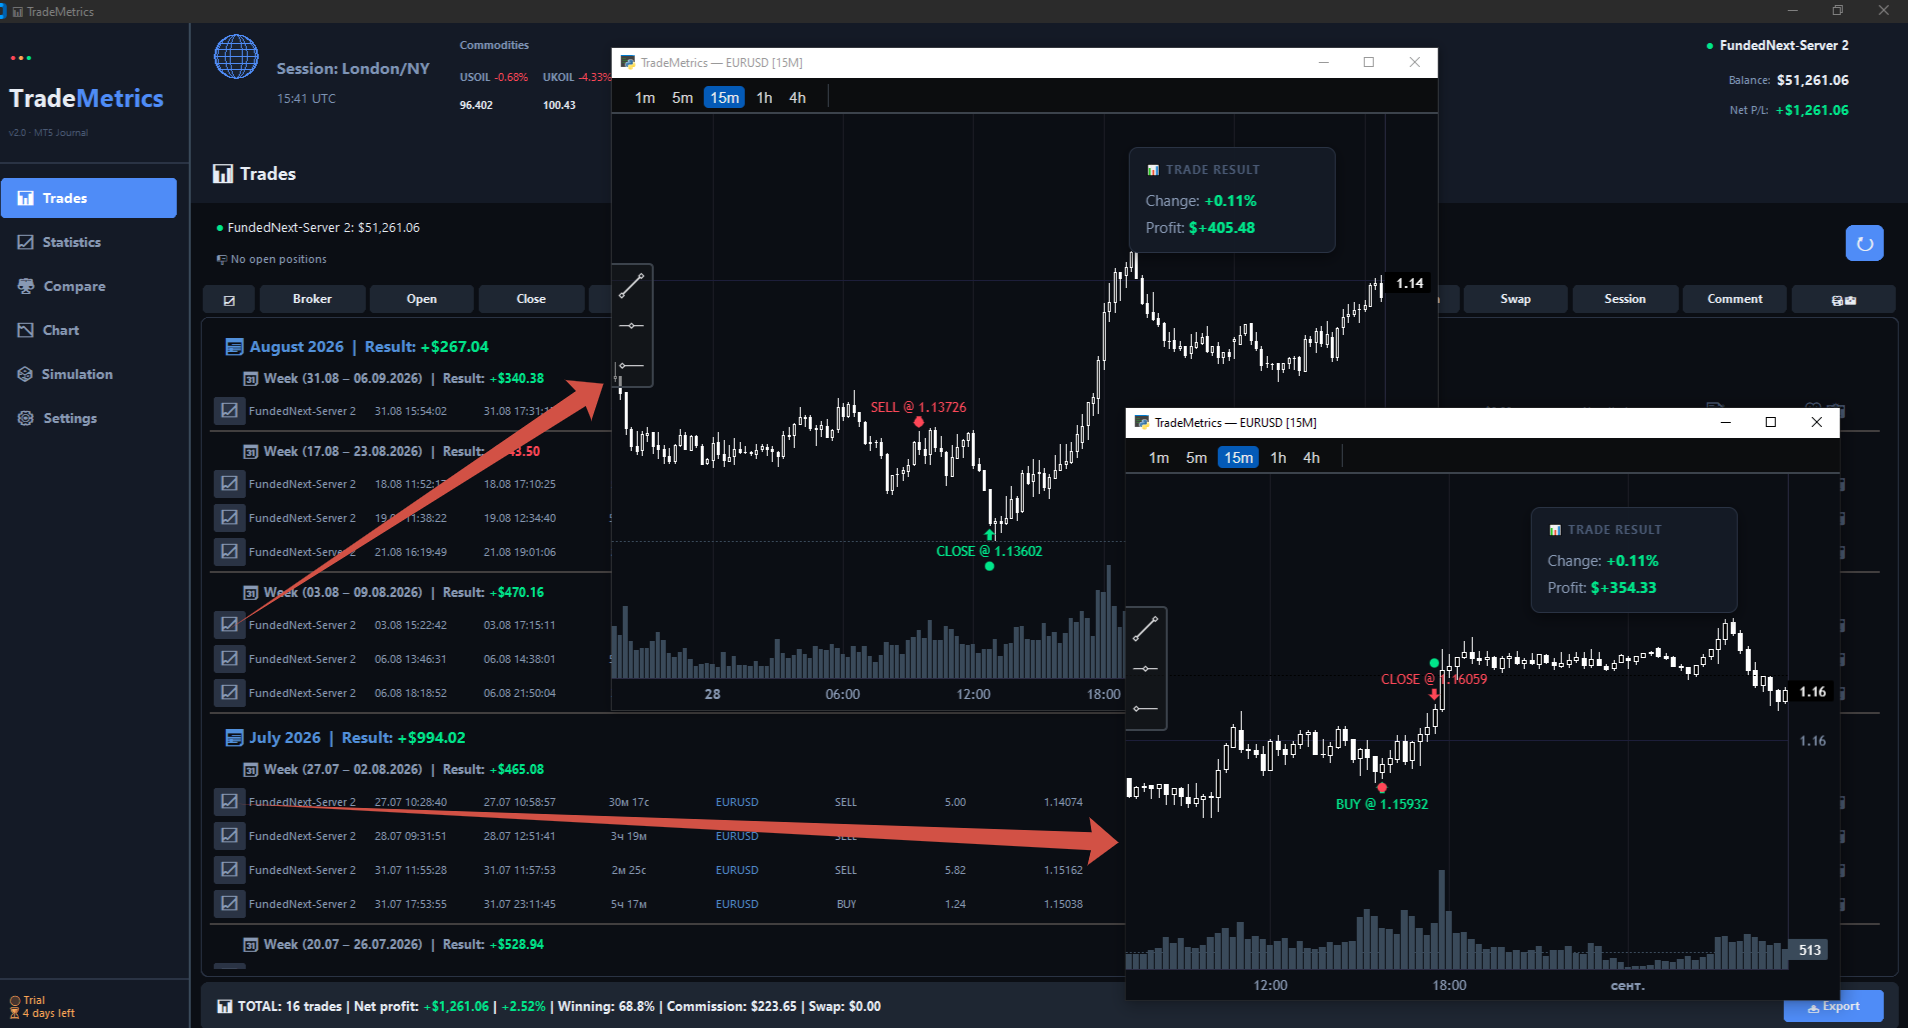
Open multiple chart windows at once — compare trades side by side
📡 Market Banner
At the top of the application there's a live Market Banner that shows real-time data — so you always know what's happening in the markets without leaving the journal.
On the right side of the banner you'll also see:
- 🟢 Connection indicator — green dot when connected
- Broker name — e.g. FundedNext-Server 2, Binance, MEXC
- 💰 Account balance — current balance from the account
- 📊 Net P/L — total profit or loss, colored green/red

Live market banner — instruments, session, and account data
💰 Initial Balance — Why enter it?
To correctly calculate percentage metrics, you need to specify the initial balance of your account. This allows TradeMetrics to calculate percentage returns — a relative value that shows the real effectiveness of your trading regardless of account size.
📊 Why this matters:
- Absolute profit (in $) — shows how much money you made
- Relative profit (in %) — shows how effective your strategy is
Example: $1000 profit on a $10000 account is +10%, but on a $50000 account it's only +2%. Percentage metrics help you objectively evaluate results!
💡 How to enter initial balance: Go to Settings → "Initial Balance" section → enter the amount and click "Save".
Supported Sources
- MetaTrader 5 — full automatic import of all trades
- Crypto exchanges — via API keys (Binance, Bybit, MEXC)
Benefits
- ✅ Saves time — no manual trade entry
- ✅ Accuracy — eliminates manual entry errors
- ✅ Up-to-date — data is always fresh
- ✅ Full history — all trades for the selected period are loaded
- ✅ Visual analysis — charts with markers for every trade
- ✅ Multi-chart comparison — compare trades side by side
- ✅ Live monitoring — see open positions in real time
🔒 TradeMetrics — Professional Trading Journal