📈 Statistics & Charts
Complete Analysis of Your Trading
TradeMetrics provides a professional set of tools for analyzing your trading. All statistics are calculated automatically based on your loaded trades.
Key Metrics
- Total Profit — overall result of all trades
- Expectancy — average profit per trade
- Win Rate — percentage of winning trades
- Profit Factor — ratio of profit to losses
- Maximum Drawdown — largest loss from a peak
- Average Profit/Loss — trade size analysis
- Win/Loss Streaks — stability assessment
- Session Distribution — Asia, London, New York
- Symbol Distribution — analysis by instruments
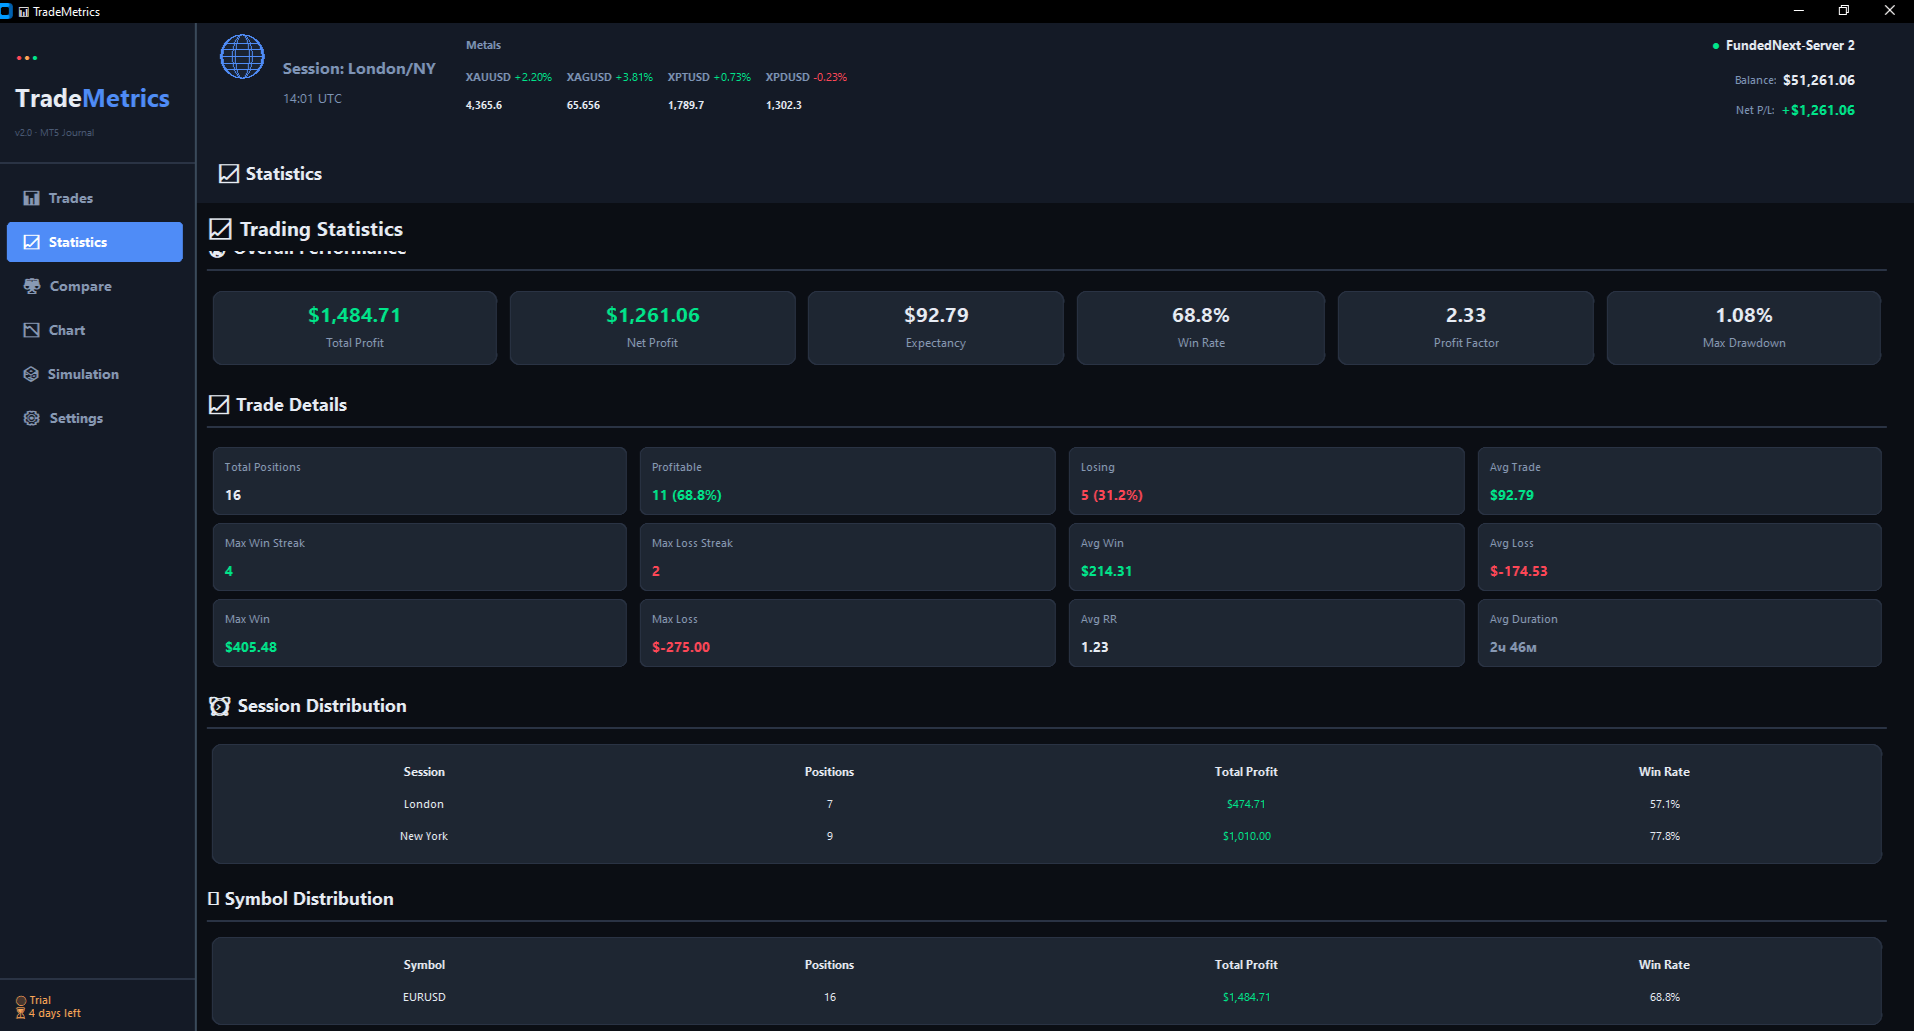
"Statistics" tab — all key metrics in one place
📉 Equity Chart
The equity chart visualizes how your trading account changes over time. It shows how your profit has grown or declined over time.
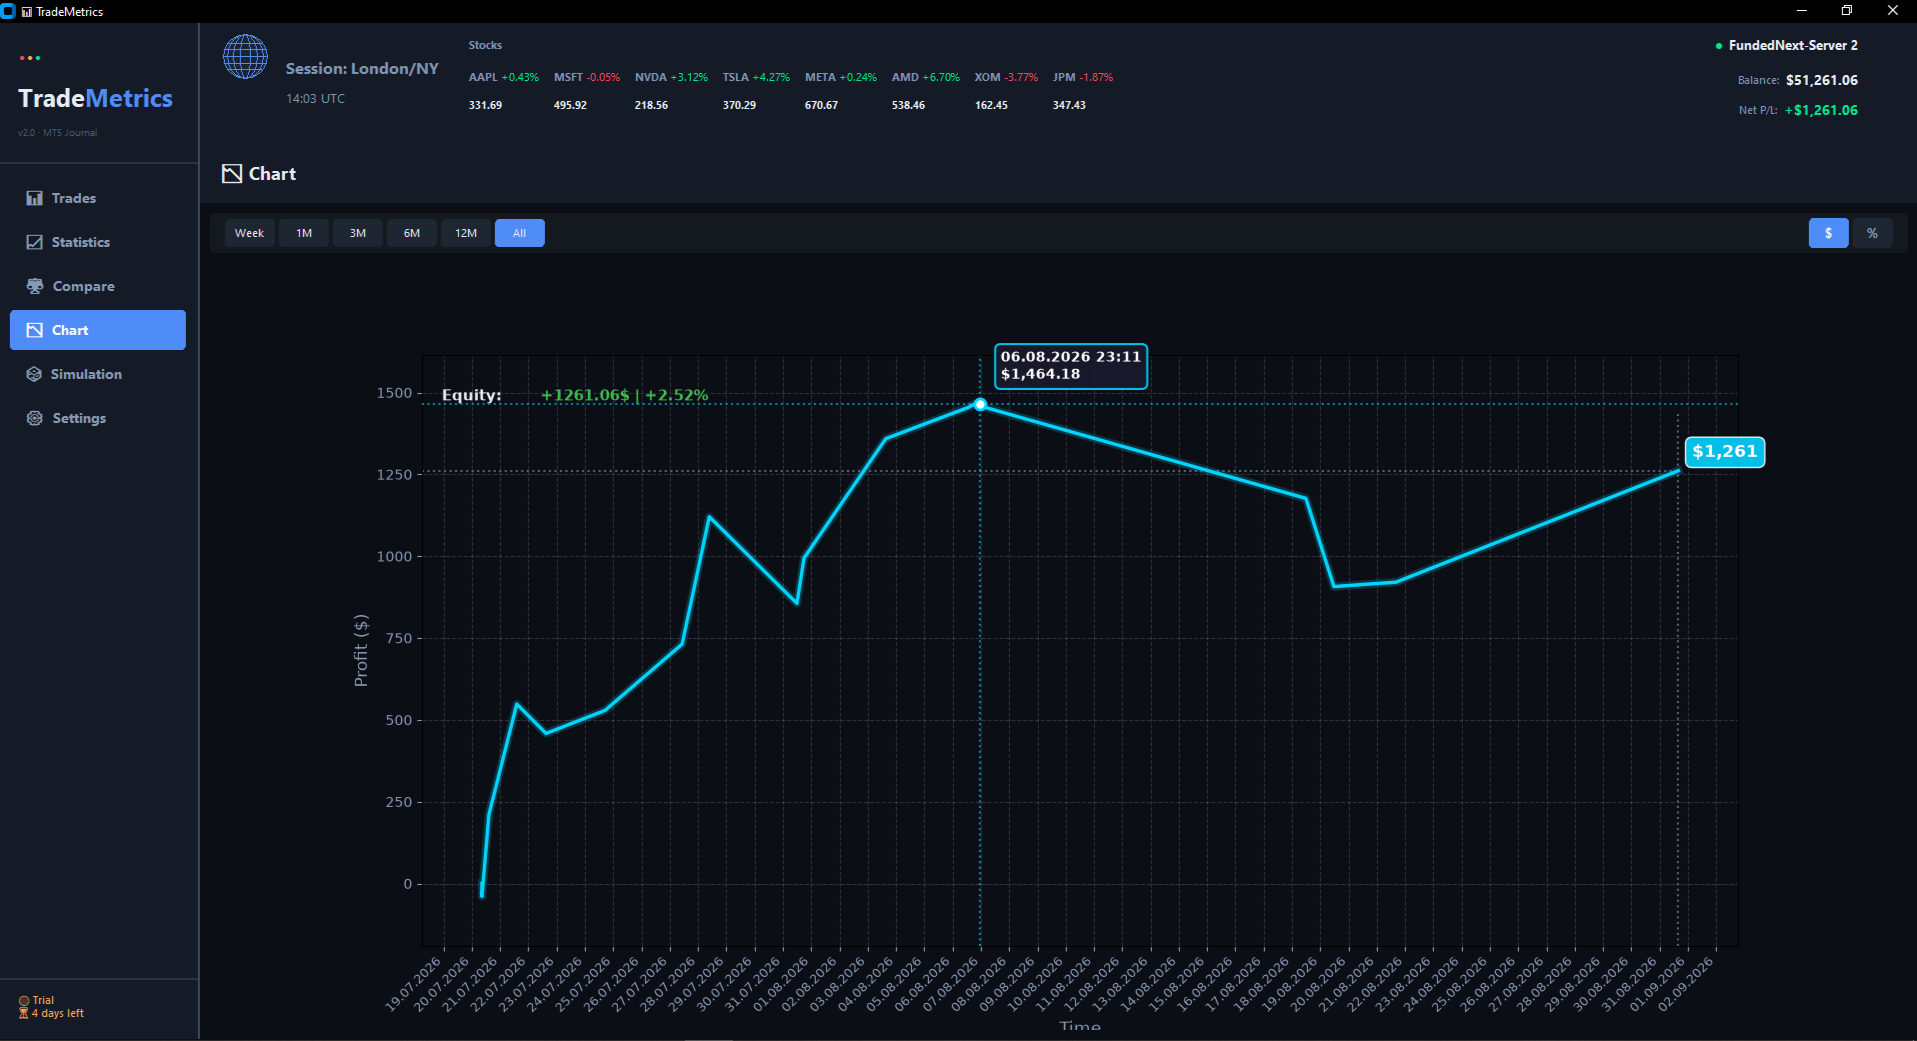
Equity chart — clear visualization of your account dynamics
Display Modes
Select Period
You can view the chart for different periods:
- Week — detailed analysis of the last 7 days
- 1 Month — short-term dynamics assessment
- 3/6 Months — medium-term analysis
- 12 Months — yearly overview
- All Time — complete trading history
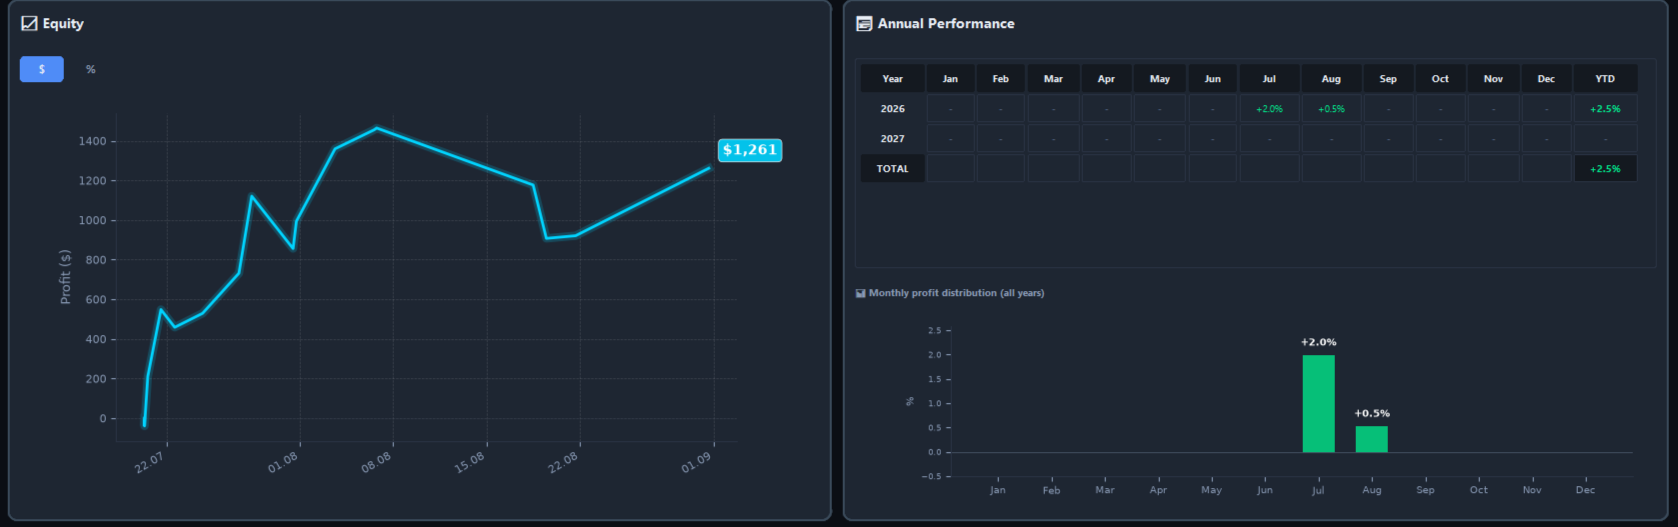
Period switching — analyze the chart for any time period
Interactive Tooltips
Hover over any point on the chart — a tooltip will appear with the exact date and profit value at that moment.
🔒 TradeMetrics — Professional Trading Journal