Charts
Six analytical charts on one screen. See your equity, drawdown, session and weekday edge, monthly seasonality, and the relationship between hold time and profit — all at a glance.
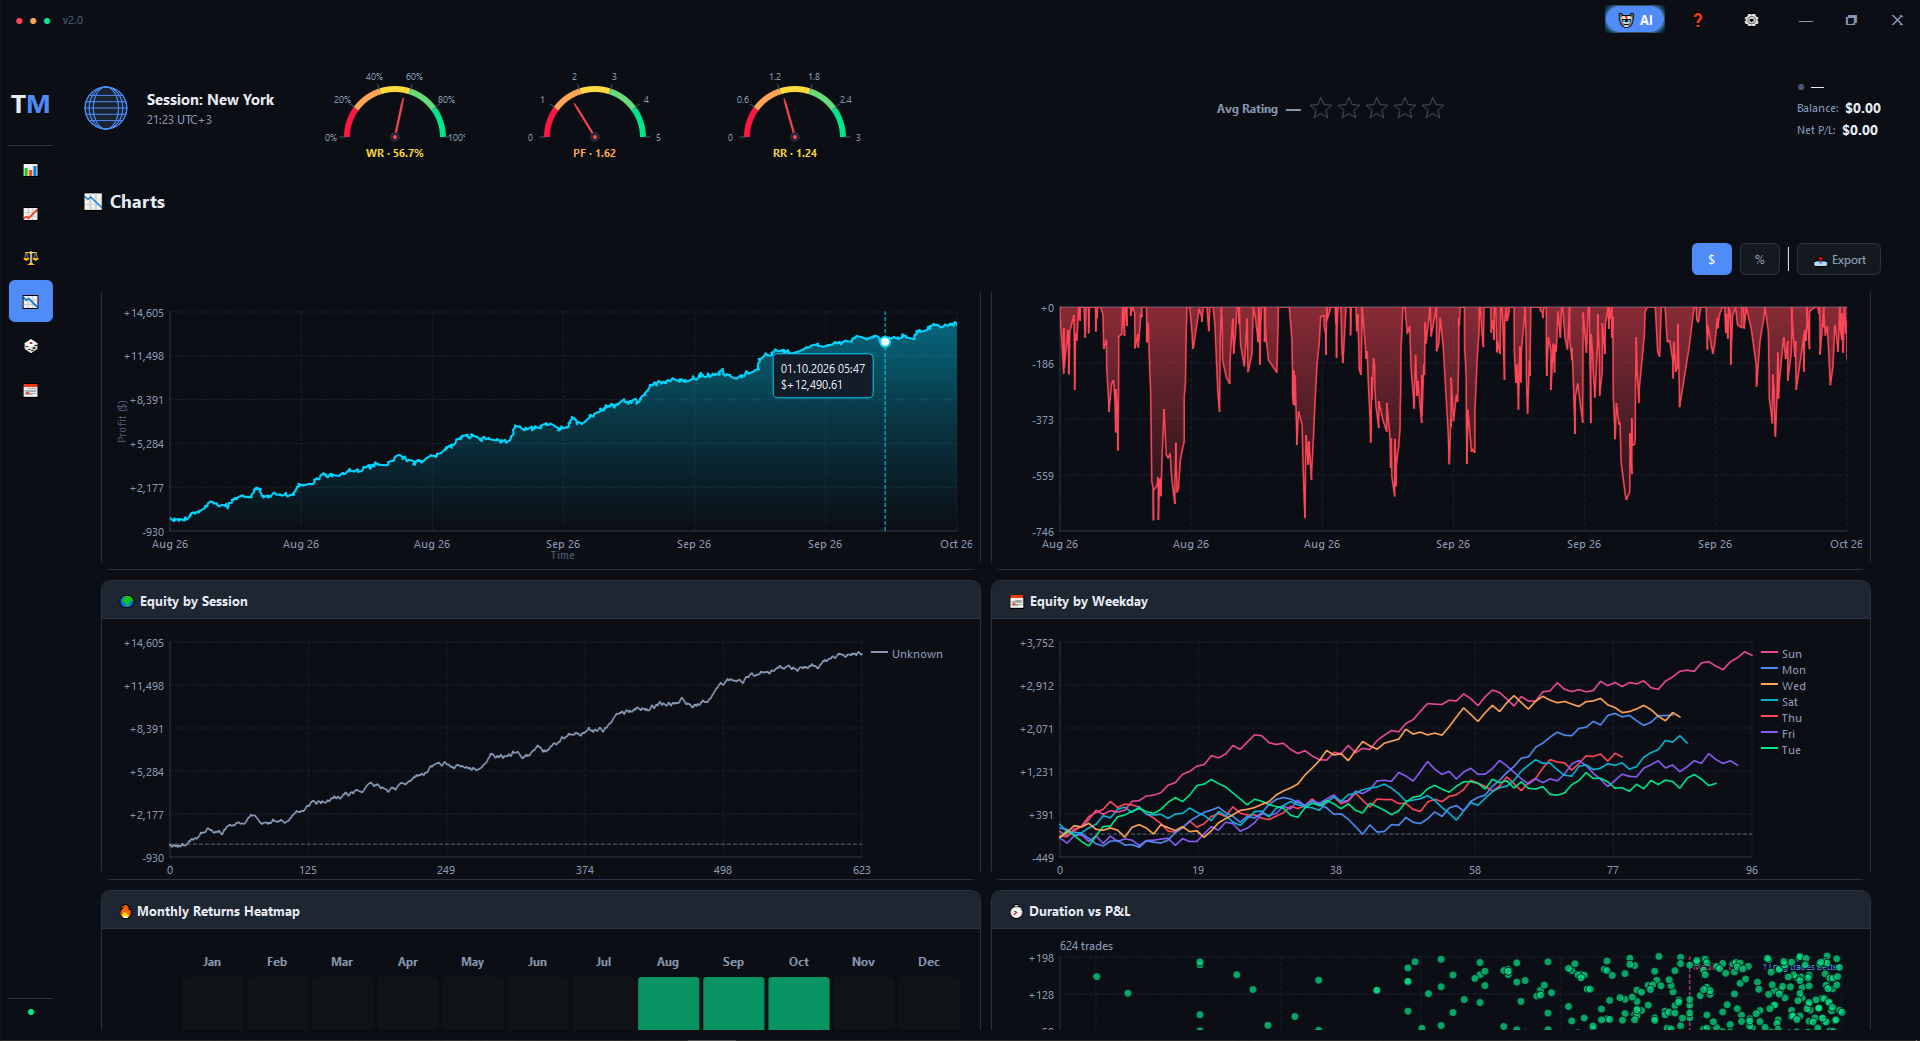
Top bar with live stats
The top of the Charts tab shows your current context in a compact band:
the active session (with your local time), three gauges
for Win Rate, Profit Factor, and RR, your
Avg Rating, and the connected account with
Balance and Net P/L. Switch between
$ and % display modes with one click, and export
any chart as an image with the Export button.
Six charts, six angles
Equity
Your account curve over time, with a soft fill under the line. Switch to % mode to compare across account sizes.
Drawdown
The underwater curve — how far below your last peak you were at every moment. Red fill shows the pain visually.
Equity by Session
Three lines — Asia, London, New York — plotted side by side. See which session actually pays you and which one bleeds.
Equity by Weekday
Five lines, Monday through Friday. Some traders earn 80% of their profit on just two days — this chart shows you which.
Monthly Returns Heatmap
A 12-month grid across all years you've traded. Green cells mark profitable months, dark red cells mark losing months — the intensity of the color shows the size of the move. Scan three years in one glance and seasonality jumps out immediately.
Duration vs P&L
A scatter plot of every trade: horizontal axis is how long you held the position, vertical axis is the result. Clusters reveal patterns — for example, «short scalps lose, longer swings win» or the opposite. Hover any point to see the trade details, and the built-in hint line tells you the optimal hold time for your current edge.
What you'll spot
- Which session carries your P&L — and which one is a slow leak.
- Your real weekday edge — maybe you should stop trading Fridays.
- Seasonal patterns — did you always have a bad August?
- The duration sweet spot — where your trades actually make money.
- Drawdown shape — fast recoveries vs long painful valleys.