Trade Chart
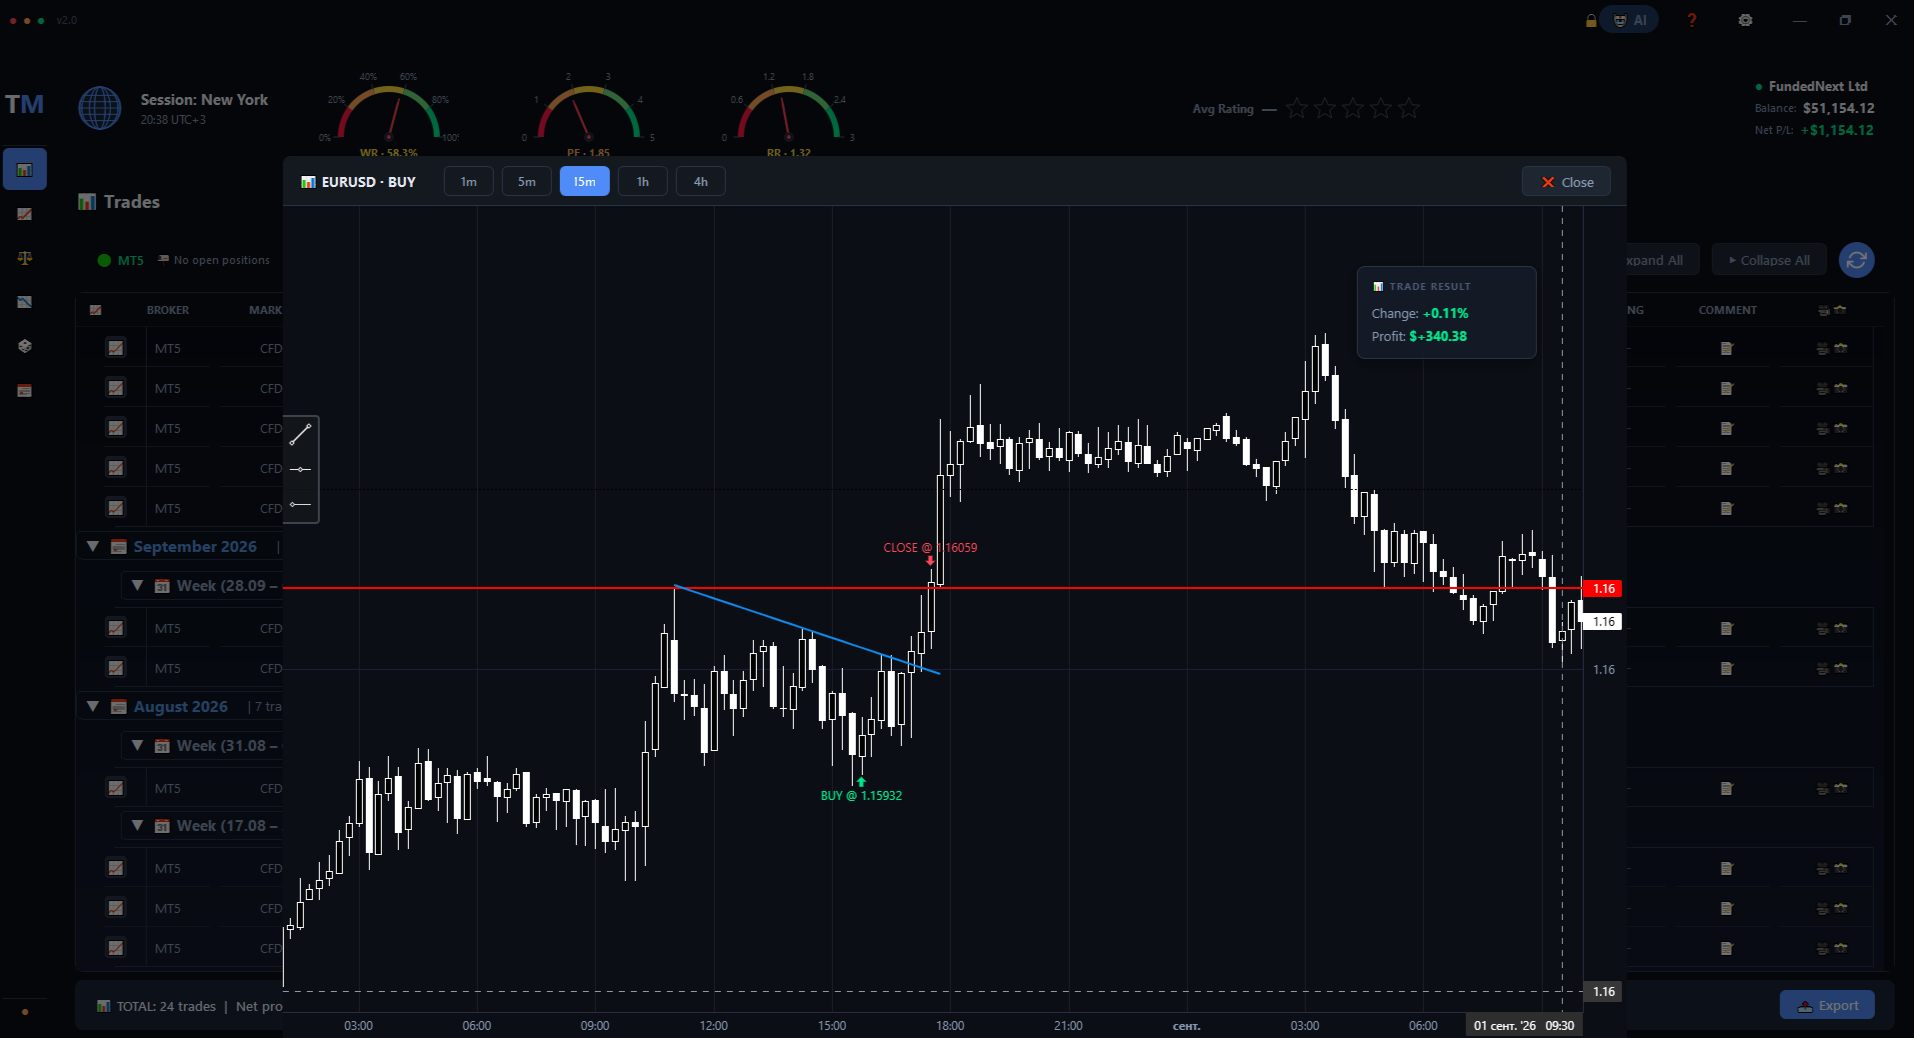
Open a live candle chart for any trade — right inside your journal. No external tabs, no switching to TradingView. Your entry and exit are marked on the candles.
Why a built-in chart matters
When you review a trade a week later, you forget what the chart looked like. Was the entry clean? Did the price wick around your level, or run straight through it? Was the exit too early?
The Trade Chart answers all of that without ever leaving the app. Click any trade in the list — the chart opens on the right, with your actual entry and exit marked on the candles.
Live candles
Real OHLC data from MEXC — the same source your crypto trades come from. Refreshes automatically.
Entry & exit markers
Both ends of the trade are drawn on the chart with exact prices — no guessing where you got in or out.
Timeframes
Switch between 1m, 5m, 15m, 1h, 4h, 1d — the chart recenters on your trade automatically.
Basic drawing tools
Draw simple lines right on the chart — trendlines, key levels, anything you want to mark for later review.
Timeframes
Every trade comes with its own timeframe — a scalper needs 1m, a swing trader needs 4h or 1d. Click any pill to switch instantly:
Markers on the chart
- Entry marker — a green or red arrow at the exact entry price and time.
- Exit marker — a circle at the close price, colored by profit or loss.
A single glance tells you whether the trade followed the plan — or went wrong the moment you clicked Buy.
Draw on the chart
Need to mark a level, a trendline, or a zone you care about? The chart has basic drawing tools — a simple line tool that lets you sketch directly on the candles. Draw a horizontal level at an important price, a diagonal trendline across the move, or a box around a consolidation range. The drawing stays on the chart while you scroll, switch timeframes, or review other trades — everything you mark is right where you left it.