Monte Carlo Simulation
Play out thousands of possible futures for your strategy. See the best case, the worst case, and the realistic range — before the market shows you.
Why run Monte Carlo?
A single equity curve is just one possible path your trades could have taken. Monte Carlo shuffles your trades thousands of times and shows the full range of outcomes — so you can answer questions like:
- What's the realistic range of my account after 100 trades?
- How bad can the drawdown get in the worst case?
- What's the probability of losing my account entirely?
Two simulation modes
🎲 Bootstrap
RECOMMENDEDDraws random samples with replacement from your real trades, preserving the actual distribution of wins and losses — including rare fat-tail events.
📊 Parametric
Uses your win rate, R:R, and risk per trade to generate synthetic outcomes. Good for stress-testing new parameters you haven't traded yet.
What you get
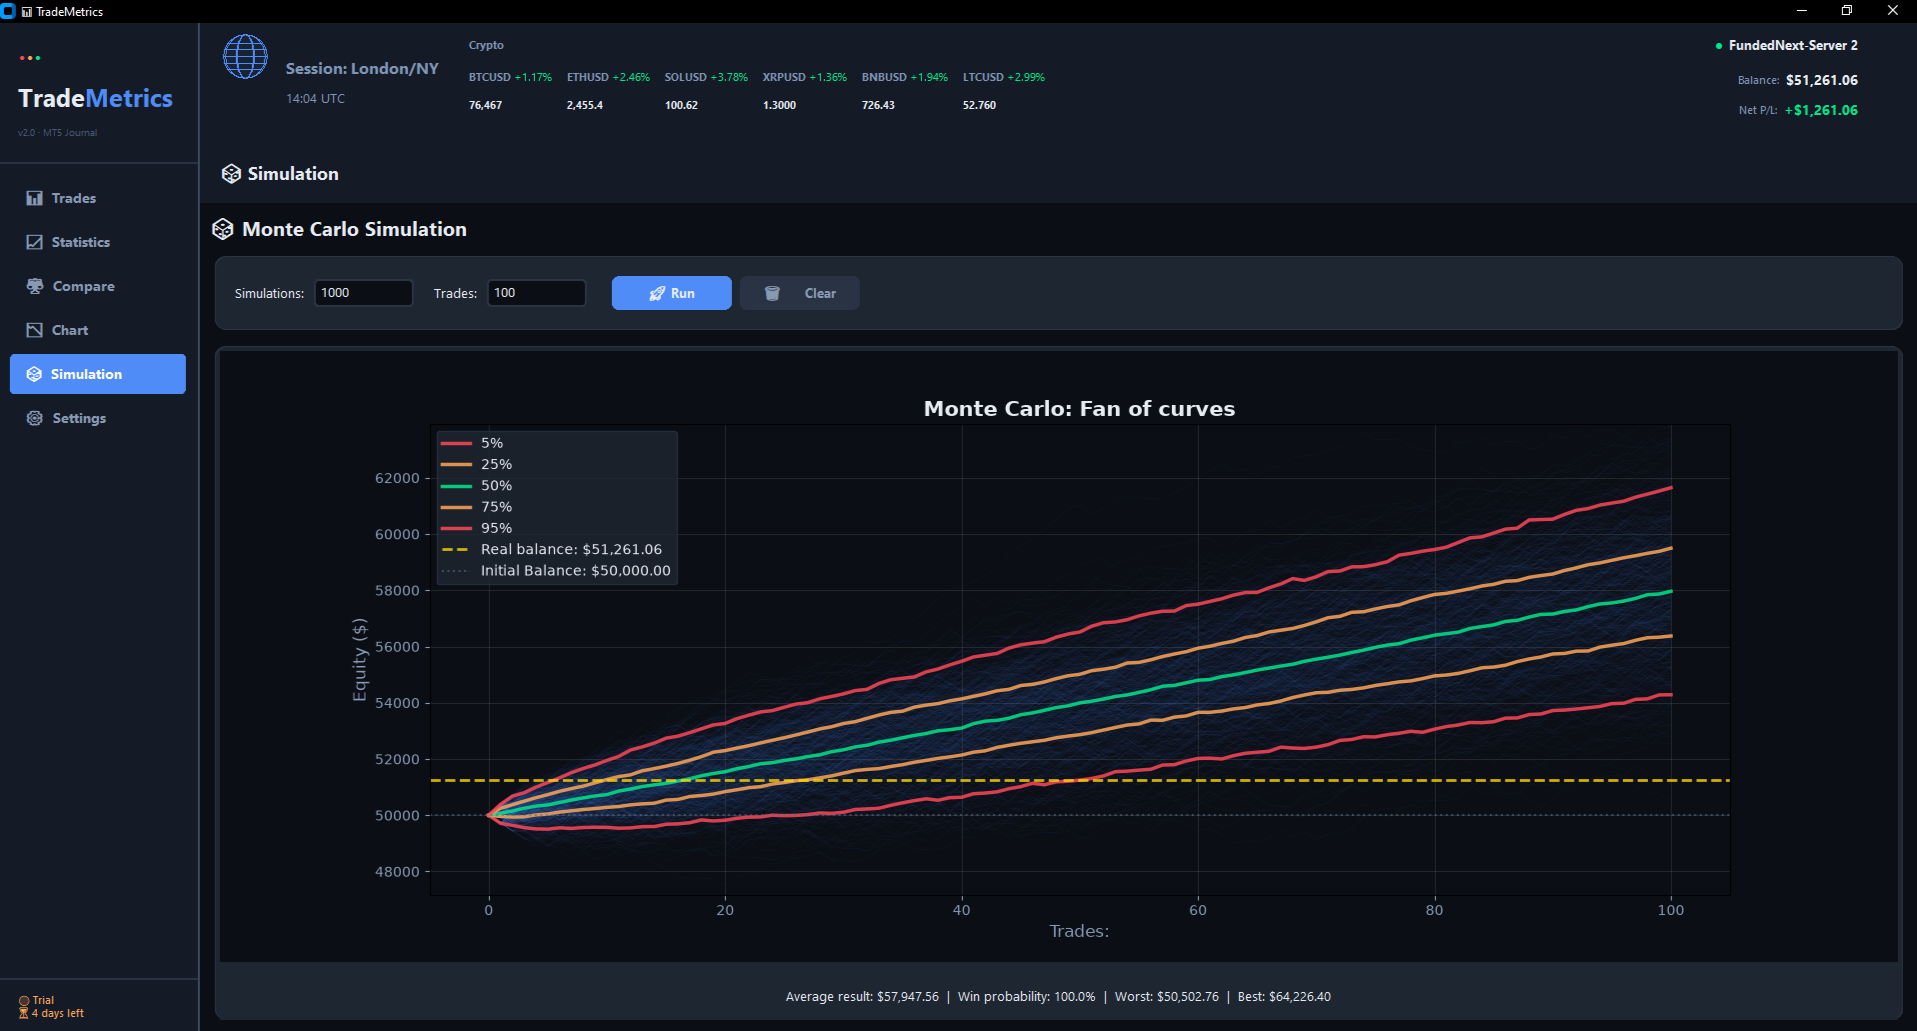
Each run produces a Fan Chart with five quantile lines (5%, 25%, 50%, 75%, 95%), plus a Result Distribution histogram of final balances. The median is the thick green line — the "most likely" path.
Extended Statistics
Sixteen metrics that go far beyond the basics:
Leverage
Set a leverage multiplier and the simulation scales both profits
and losses — proportionally. A 2.0× leverage doubles VaR, CVaR,
and maximum drawdown, while doubling expected returns. Use it to model margin
strategies or to stress-test your risk.
Let AI read the results
After a run, open the AI Assistant and ask it to analyze the simulation. It walks through every metric, warns you about leverage risk, and gives concrete recommendations. See the AI Assistant page for details.